Demand Variability Management
Primary Information
Usman Butt
ubutt@ccbpl.com.pk
+923008472376
Coca-Cola Beverages Pakistan Limited (CCBPL)
Lahore, Pakistan
Introduction & Context
Pakistan is a vibrant country located in South Asia. As a beverage market, while Pakistan presents an exciting growth opportunity, it offers its fair share of challenges as well.The country’s growth opportunity is driven by its large population and GDP growth, followed by steady infrastructure development. According to the World Bank, population growth rate of Pakistan is 1.8%, one of the highest in the region against China (0.48%) and India (1.37%) (World average is 1.16%). The country’s GDP has also demonstrated a significant growth of 2.8% over the past four years, against the world average of 1.55%. Although infrastructure is currently underdeveloped by international standards, it is rapidly catching up. This is elicited by the fact that there has been a 54% increase in length of road network over the past twenty years and this trend is expected to continue. Moreover, Shipping Connectivity Index, measuring facilities available at Port and handling of international cargo traffic, has jumped up to 39% over the past eight years, again demonstrating a sound growth in the country’s infrastructure.
In Pakistan, Coca-Cola products are manufactured and distributed by Coca-Cola Beverages Pakistan Limited (CCBPL), a subsidiary of Coca-Cola Icecek (CCI). It operates six bottling plants across the country to supply seven sales territories. It sells around 47 SKUs that include both PET and RGB packs, with 40% of all sales volume contributed by CSD RGB packs. About 70% of the volume is channeled through distributors and 30% is directly sold to retail outlets. Chilled Beverages business is seasonal in Pakistan, with around 40% of volume sold in second quarter (summer).Over the past, the company has witnessed tremendous growth in the market with last ten year’s CAGR at 21.3%. It currently holds around 30% market share with a gain of +2.6% in the past year. This fast-paced growth however, has put strains on supply chain on many fronts.
Firstly, PET production capacity utilization is touching its peak of 90% this season. Moreover, RGB production is dependent upon timely return of empty glass from the market, which is dependent upon sales trend.
Secondly, high double-digit growth has outgrown warehousing capacities. During peak season, CCBPL only has 3.4 days of coverage for RGB and 6.3 days for PET. This situation is further aggravated by the irregular sales pattern, which limits pre-season stock building.
Thirdly, Pakistan’s transport market is still under-developed, with key players lacking the necessary muscle and sophistication of other Asian markets like Turkey and China. The limited availability of customized vehicles due to two crop cycles, Afghan Transit Trade and other factors, reduces CCBPL’s capability to cater to irregular and unexpected sales pattern. Extra cost of managing high dispatches from warehouses during last week high demand also is an issue.These constraints therefore necessitate the effort to smooth out the sales curve to counter capacity limitations and better serve orders in full and on time, without losing volume to arising opportunities.
The Problem
The majority of CCBPL’s sales demand for any given month is concentrated in the last few days, due to a sudden surge of orders at month-end. On average, these last four to five days account for 35% to 40% of the total volume for a given month, clearly skewing the sales trend.Moreover, daily sales touch as far as +/- 3 standard deviations from mean sales of the month. This adds another aspect of unpredictability to sales curve, in addition to skew- ness.
Suheadline here
Given the limitations for supply chain, this skew-ness causes adverse implications for the fulfillment process. These implications can be broadly divided into three major categories.
Firstly, this unpredictability and month end skewedness enhances transport capacity outages and under-utilization. Since sales levels are low in initial weeks of the month, most of the dedicated fleet is idle, leading to higher fixed cost per case shipped. Similarly, the sudden surge of orders at month- end leads to hiring of vehicles from the market at spot rates, resulting in higher freight cost.
Secondly, concentration of sales at month-end puts pressure on RGB productions in initial weeks because glass empties are not available (RGB is 40% of sales volume). This also limits the ability to build stocks for the last week. Moreover, PET production runs also suffer from breaks due to choked
Desired Outcome
Currently last week contributes 35% to 40% of monthly sales. It is recommended to be brought down to 25%-28% range in order to reduce pressure on the order fulfillment process. This will greatly reduce vehicle turnaround time and cut HC requirements by scaling down operations to 2-shift from 3- shift. On transport side, vehicle utilization will improve and ad-hoc arrangement of vehicles from the market will decrease to save cost. In the same way, the commercial front will gain as a smoothened sales curve will improve customer service, which in turn would reduce OOS and augment sales through capturing lost opportunities.
Alternatives Considered
There were many possible approaches to tackling this problem. A subset of alternatives is given below.
- Capping maximum volume allowed in last week
This approach consisted of stock upliftment checks on distributor sales and assign quota / allowance for distributors to control accumulation of orders at month-end.
- Adding additional toll-fill capacity for supply chain to accommodate month-end sales
Since a major portions of limitations pertain to capacity- related problems, it was suggested to add a stand-by capacity on rental basis to handle the overflow at month-end. But further deliberations revealed the shortcomings of this solution as it doesn’t address the core problem at hand, but tries to palliate the symptoms and implications.
- Taking average pre-season stock levels by 10% to 20% to absorb changes in sales curve
Currently, CCBPL has an average stock of around 6 Million unit cases before start of season. This can be increased by 15% to 20% to be able to absorb any spikes in sales curve. But such high levels of stock would require additional rental warehouse space and also carry the risk of wastages and expiries.
- Improving the sales process
It involves improving the target periods and deadlines along with incentivizing the sales force to improve consistency of customer orders. This solution looks more promising than the rest as it strives to improve the sales pattern itself. Compared to other alternatives, it is also the most cost effective one as well. Therefore, this has been chosen for implementation.
Solution Selected or Action Taken
Since this is a chronic problem affecting not just CCBPL but also other major players in the industry, the very process of sales and incentives attached to it need to be re-engineered. Therefore, following improvements have been proposed.
- Shorter Target Periods
Currently monthly sales targets are set both for sales staff and distributors. Shorter target periods, e.g. fortnightly or weekly targets will reduce demand pressure at month-end and will break the last week sales peak into smaller portions.
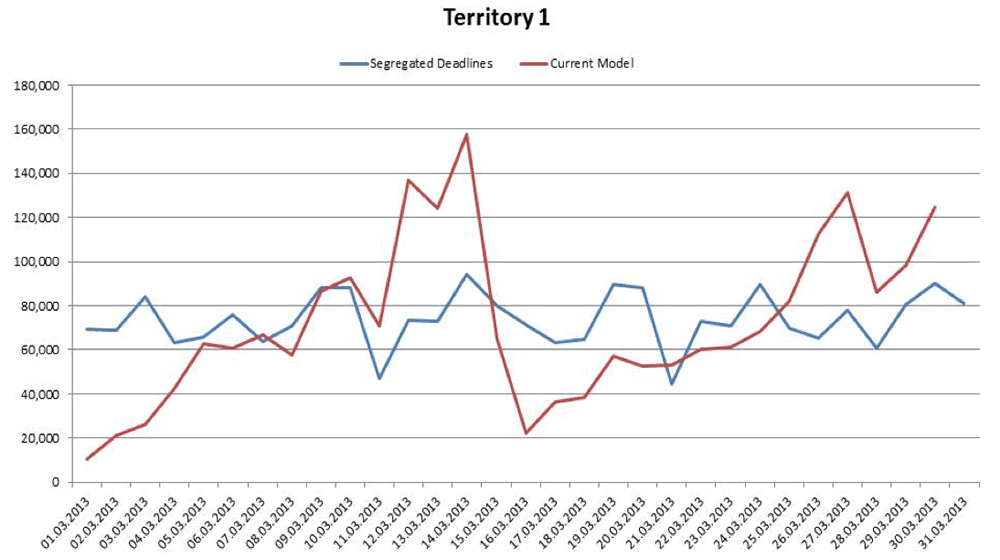
- Staggered Target Deadlines
Current target deadlines for all customers fall on month-end. This results in accumulation of smaller month-end peaks for individual customers into a large peak that is difficult for the company to handle. By spreading out these deadlines within a month, crests and troughs in demand will tend to smooth out, to produce a more ideal sales curve.
- Transition from Sell-In to Sell-Out
Current target setting for sales to distributors (70% of volume) is based upon Sell-In (CCBPL Sales to distributors). Shifting these targets to Sell-Out (Distributors’ sales to retail outlets) will help reduce stock building at month-end. Moreover, it will shift focus of sales staff towards increasing distribution as well.
- Setting the right incentives
Currently, most of sales force’s incentives are based upon overall target achievement, irrespective of consistency of orders. Tying a portion of these incentives to consistency of orders will create motivation for improvement of sales pattern.
Key Learnings
The expected learning was that everyone at the top would acknowledge the issue and would support the initiative. However, it was not very well received by sales team and distributors down the line. Some detailed presentations to field staff and some sample distributors brought an unexpected change and some of commercial team became our best ambassadors to roll out these initiatives.
References
United Nations Population Division, Department of Economic and Social Affairs
The World Bank Population Databank
Economist Intelligence Unit, 2010